
EMPLOYEE ENGAGEMENT

|
There is no official definition of
employee engagement, but at a basic level the term
describes the level of enthusiasm and dedication that a
worker feels towards his/her job and the organization.
The concept has gained increasing importance as numerous
research studies have shown a positive link between
employee engagement and both performance and
productivity at an organizational level. This is not
surprising since engaged employees care about their work
and the performance of the
organization.
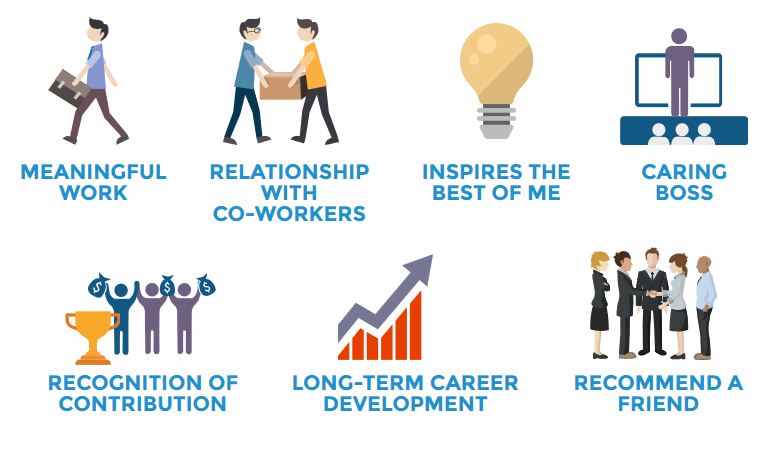
There is no generally accepted model to measure employee engagement, with different companies using different measures. Some companies employ a battery of questions to measure hundreds of variables. We recognize that the quality of employees’ responses declines with the length of the questionnaire and so there is a need to keep the questionnaire as short as possible. We have therefore limited our employee engagement component to the measurement of what we believe are the 7 main drivers of employee engagement. These include: |
PROPENSITY TO LEAVE

|
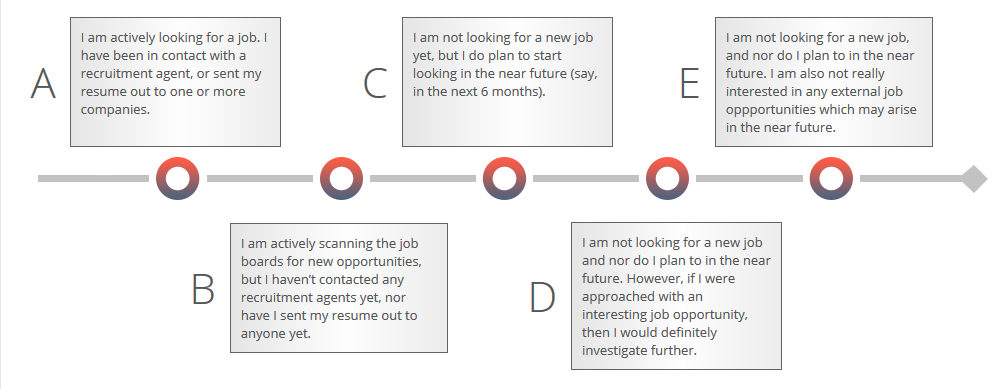
If you want to reduce the turnover of
your talented employees, it is crucial to know how
likely each of them are to leave in the next year. In
our survey, we ask employees which of the following
profiles best describes their situation:
|
OUR EMPLOYEE SEGMENTATION MODEL
The FeedbackRocket Employee Segmentation model is a powerful way
to segment your employees. We identify exactly how many of your employees are in
each of the 4 segments shown below.
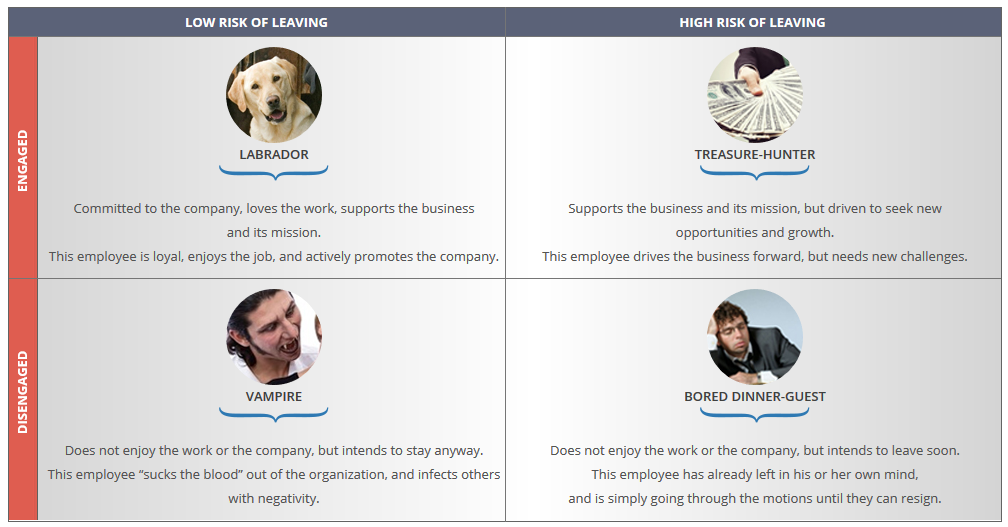
HIGH-LEVEL VIEW OF GOOD & BAD AREAS

|
Based on extensive research, we have
identified the 85 main causes for employee turnover.
These have been classified into 11 broad
categories:
|
For each of the 11 main categories we investigate in the survey,
we show exactly which ones are perceived to be strength areas within the
organization and which are perceived to be weak areas.
WHAT IS GOOD ABOUT THE ORGANIZATION
|
The FeedbackRocket Climate Survey is
geared to identify the problem areas within the
organization, rather than focus on the strengths.
However, we also ask employees what is GOOD about
working for the organization. We read every comment and
identify the underlying theme for the given comment. We
then group all the comments under the respective themes
together in order to provide a rich picture of what is
perceived to be working well within the
organization.
The verbatim comments in this section can also be used effectively in your employer branding communication, in order to attract talent to the organization. |

|
SPECIFIC SUB-PROBLEM AREAS TO FOCUS ON

|
ach of the 11 main areas described
above can be broken down into more detailed sub-category
problem areas, which enable us to gain a much deeper
level of understanding of the main problems being
experienced by the employees. In total, we have
identified 85 of these sub-problem areas which cover 99%
of the main causes for employee turnover.
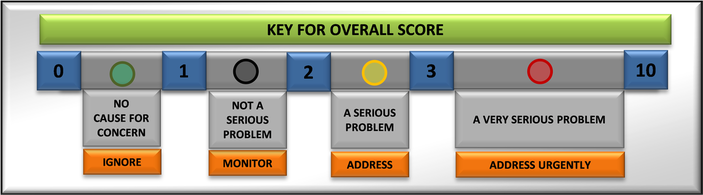
By seeing which of these sub-problem areas are particularly problematic for the employees, we can identify the specific areas which need work in order to make improvements. We also classify each sub-problem areas according to the key below. We identify all the Very Serious Problem Areas & Serious Problem Areas that you should focus on in order to have the biggest impact on talent retention. |
INSIGHTFUL COMMENTS IN CONTEXT
|
For each of the 11 main areas we
investigate in the survey, we ask the employees two
important open-ended questions:
We read every single comment from every single respondent and identify the underlying theme for each of the comments. We then group all the comments under the respective themes together and place them in the main report in the most appropriate place in order to provide invaluable context to the specific problem hot-spot areas that have been identified. |

|
Issues and themes raised here are impossible to capture in a
traditional quantitative climate survey, and enable you to identify issues that
would otherwise be buried under the surface.
This combination of qualitative feedback together with quantitative analytics provides an incredibly powerful overall picture of the problems being experienced by the employees and what needs to be done about them.
This combination of qualitative feedback together with quantitative analytics provides an incredibly powerful overall picture of the problems being experienced by the employees and what needs to be done about them.
DEMOGRAPHIC HOT-SPOTS

|
For all the results in the previous
sections (apart from the open-ended comments, due to
confidentiality), we enable to you break down the
results by specific demographic splits, such as:
We provide you with a Custom Insights Tool which enables you to see the results for whatever demographic data cut you like (eg. black female employees, or Millennials who have been working in the organization for less than a year, or managers in a specific department, etc.). This is an incredibly insightful and useful view. |
NATIONAL BENCHMARKS
Finally, the results for your organization can be compared
against the average of all other companies that have also completed the
FeedbackRocket Climate Survey. This provides a very useful benchmark for
comparison.